In 2021, there were 3.0 million unemployed young people (aged 15-24 years) in the EU and the youth unemployment rate was 16.6%.
Statistics
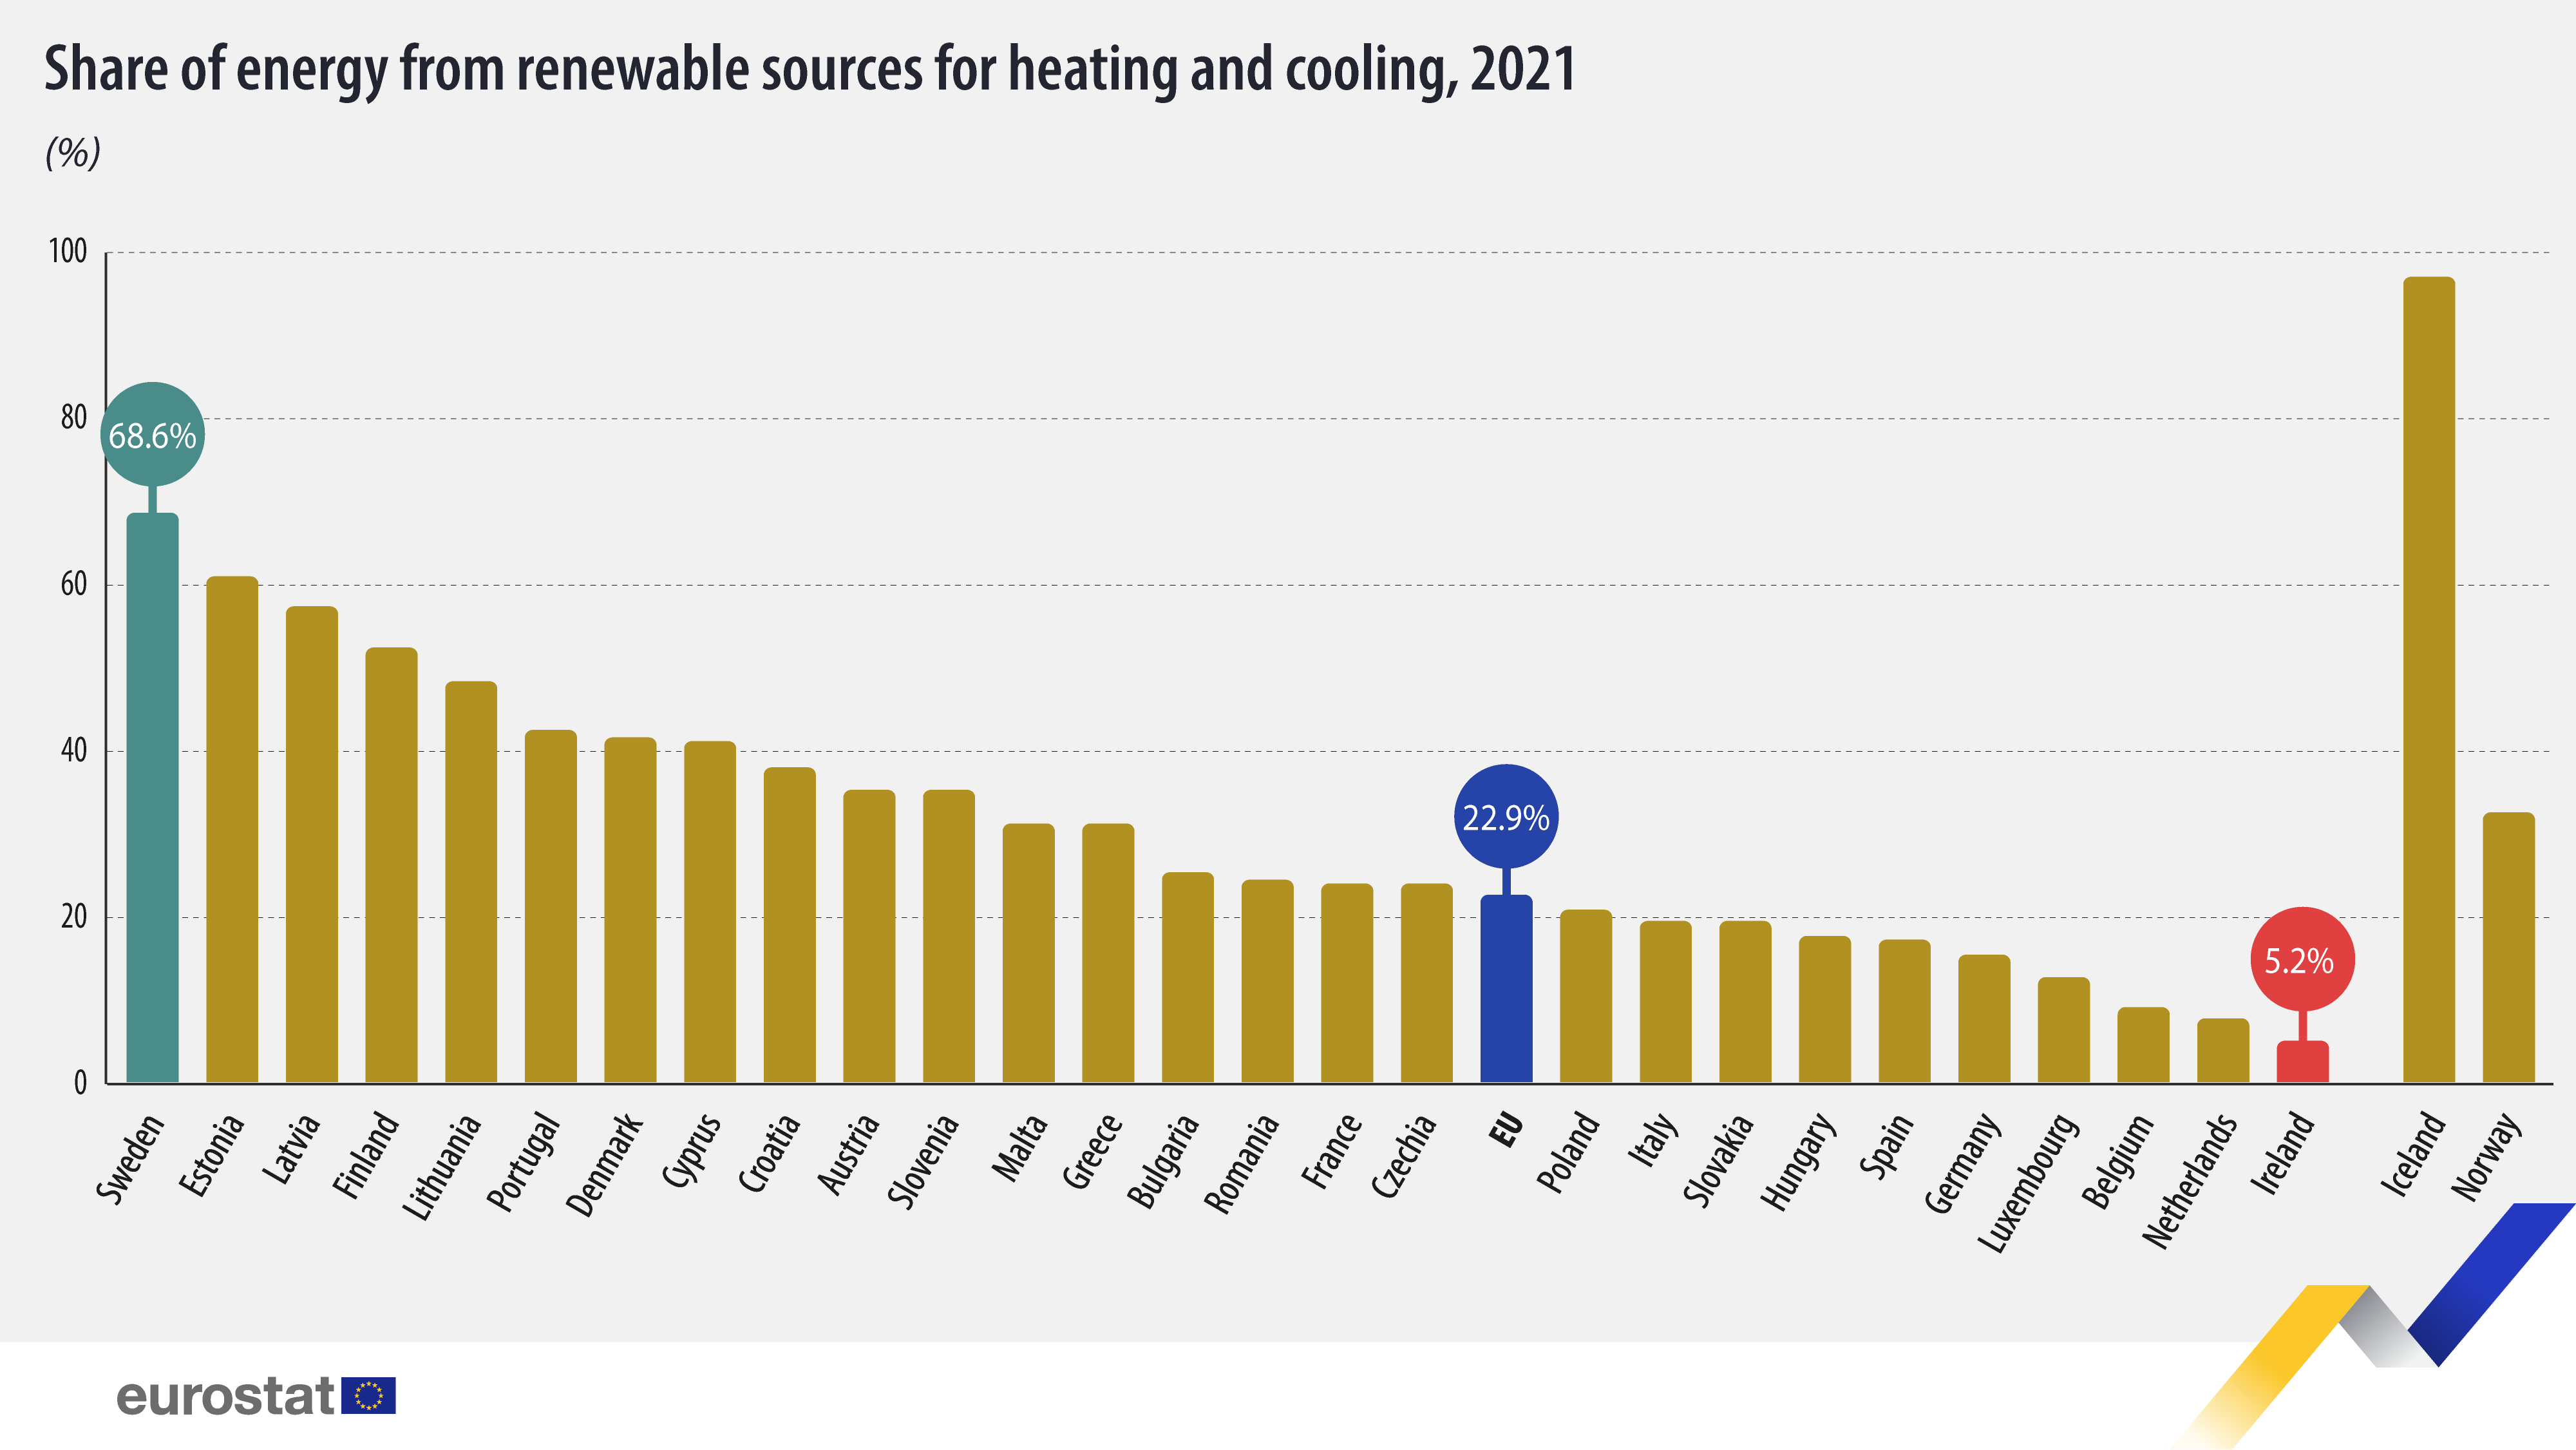
Energy for heating and cooling represents almost 50% of the EU’s total gross final energy consumption.
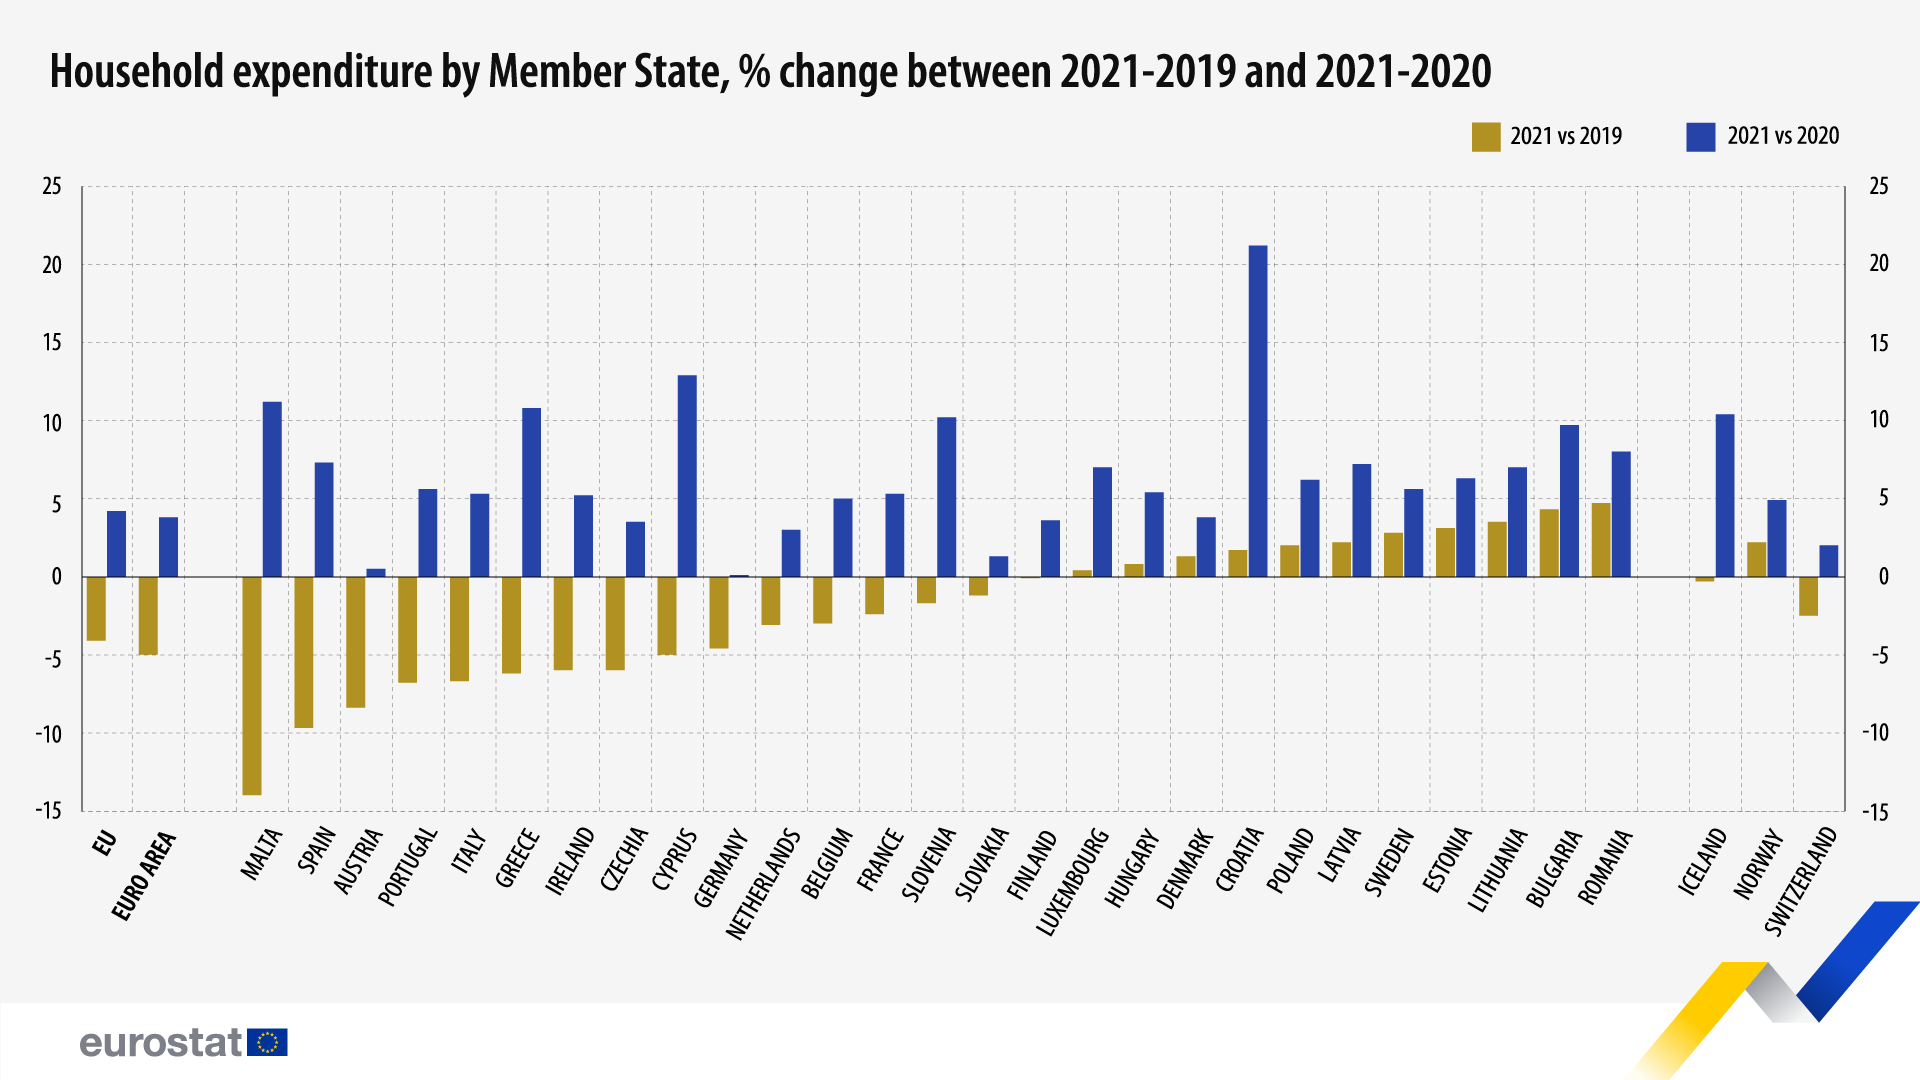
Ηousehold consumption expenditure in the EU increased In 2021 by 4.2% compared with 2020, but is still 4.1% lower than in 2019.
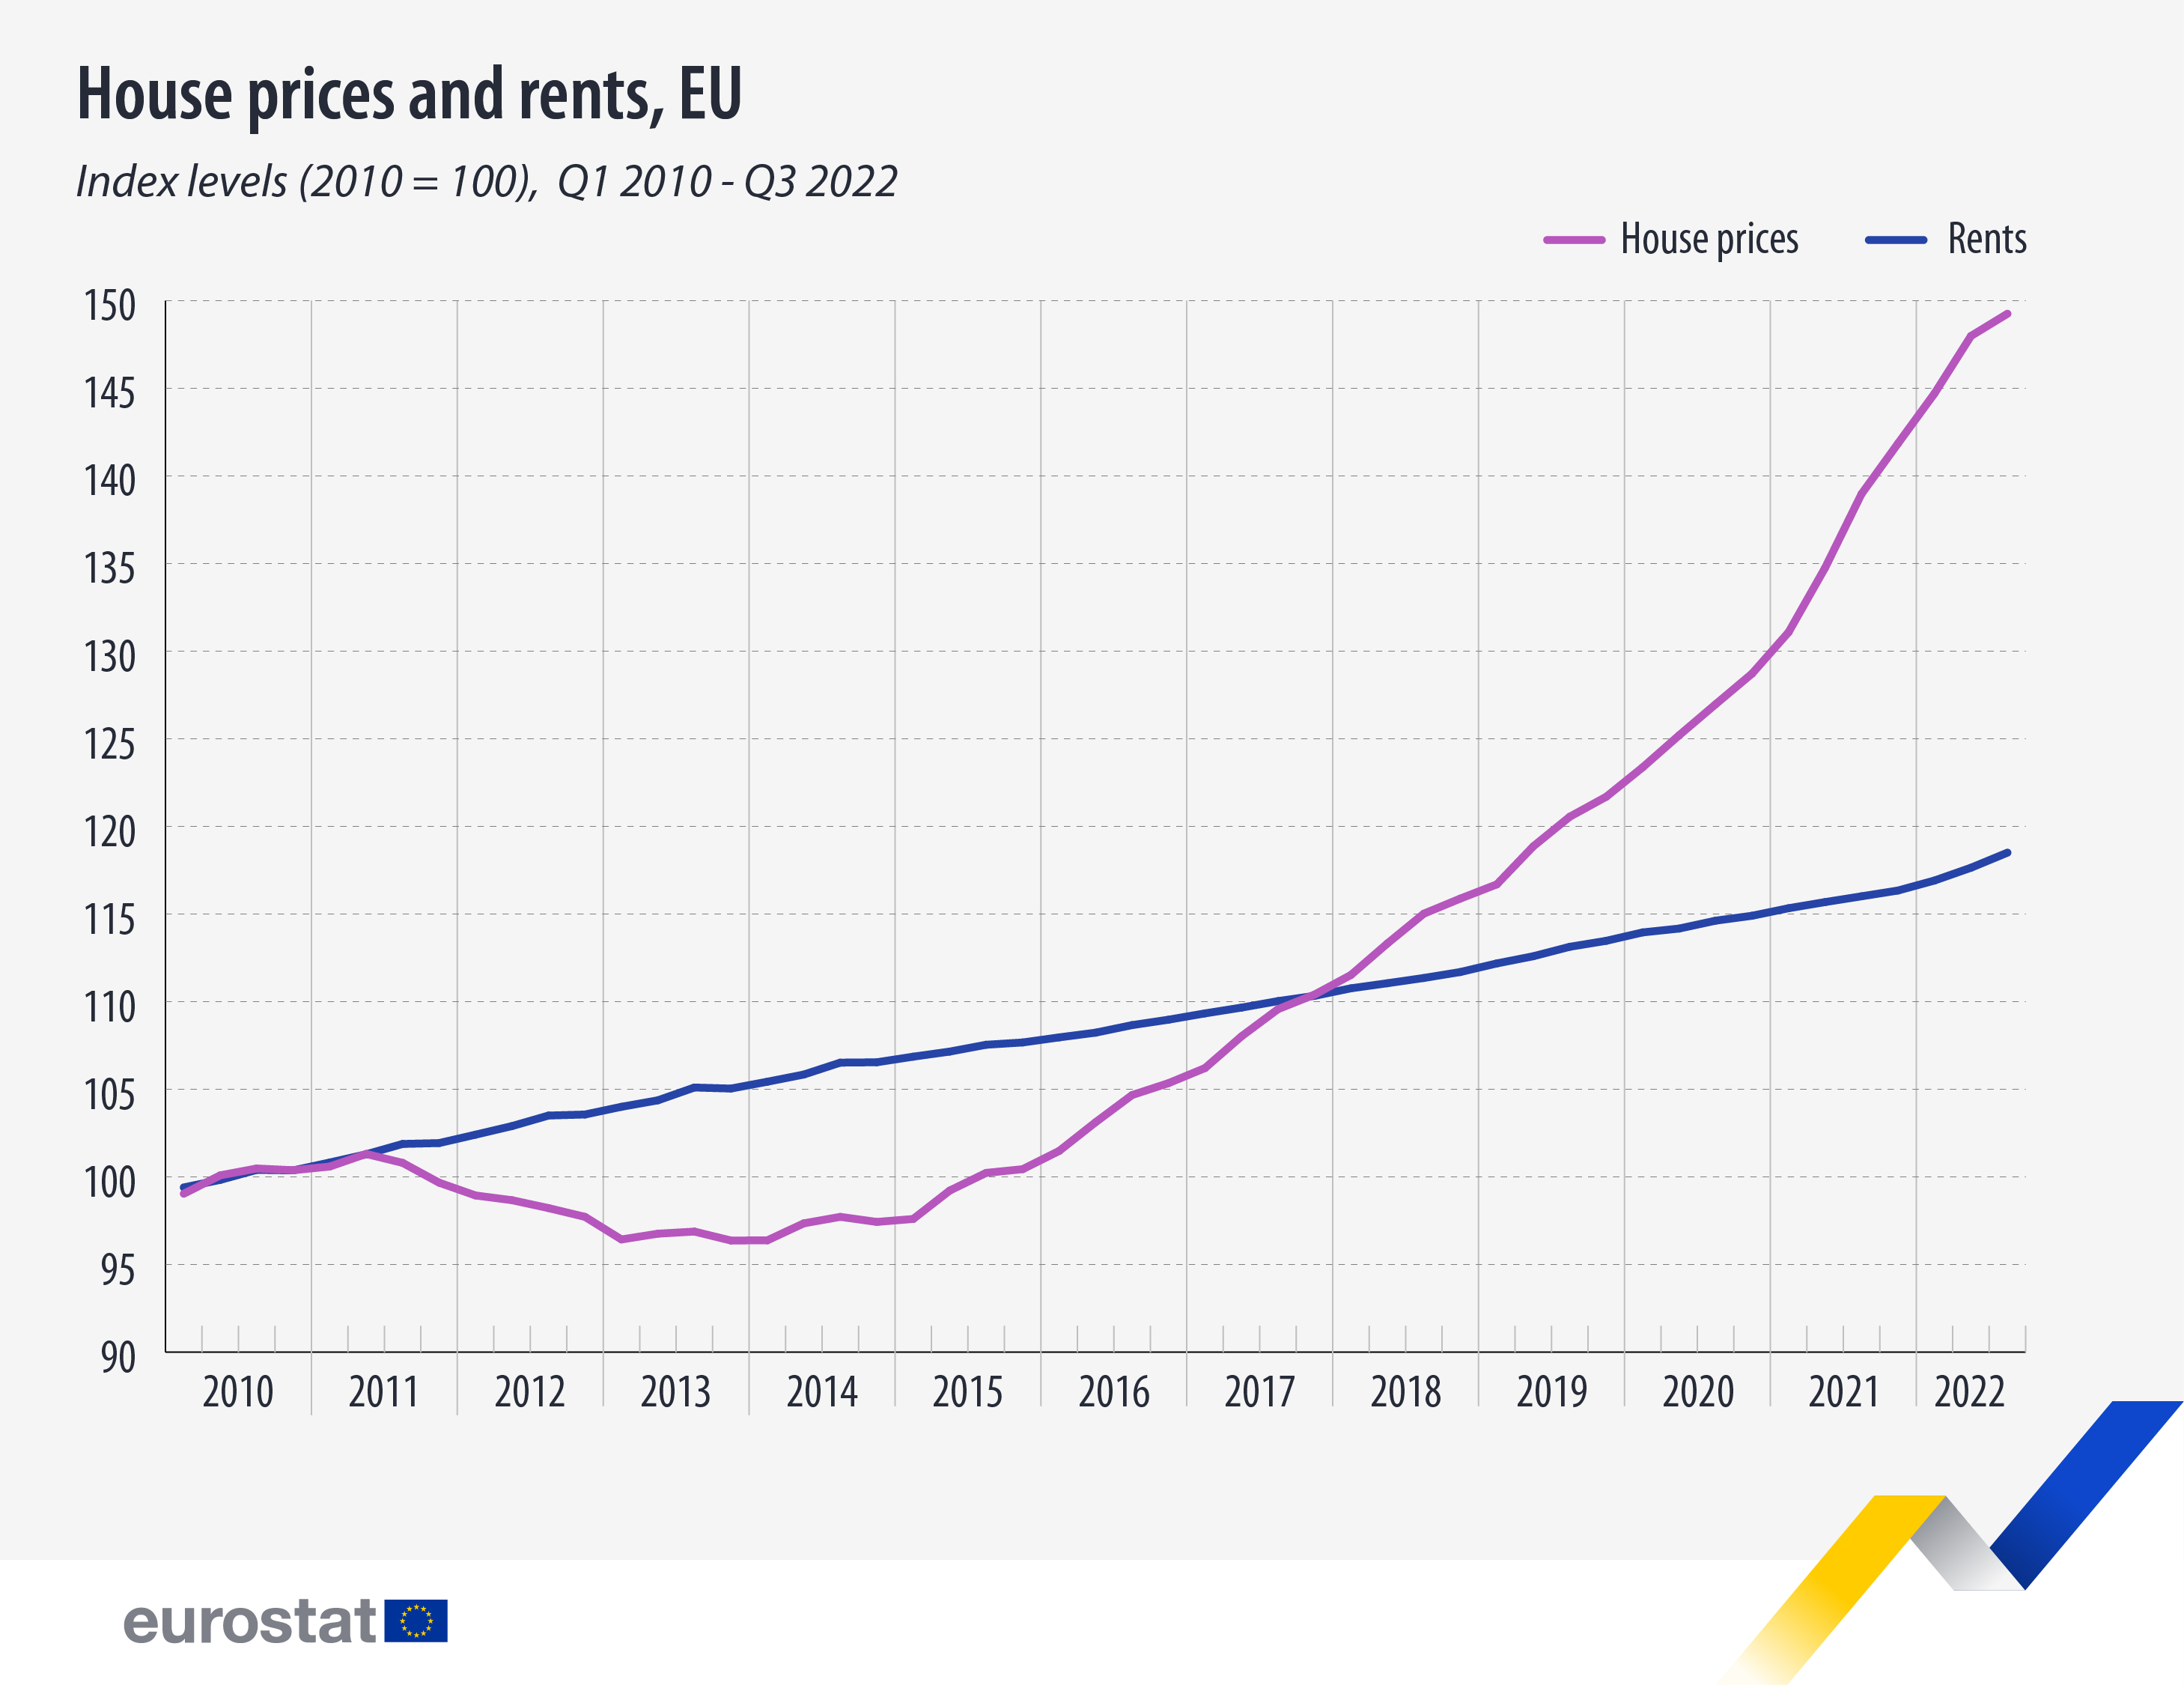
Rents and house prices in the EU continued to increase in the third quarter of 2022, going up by 2.1% and 7.4%, respectively, compared with the third quarter of 2021.
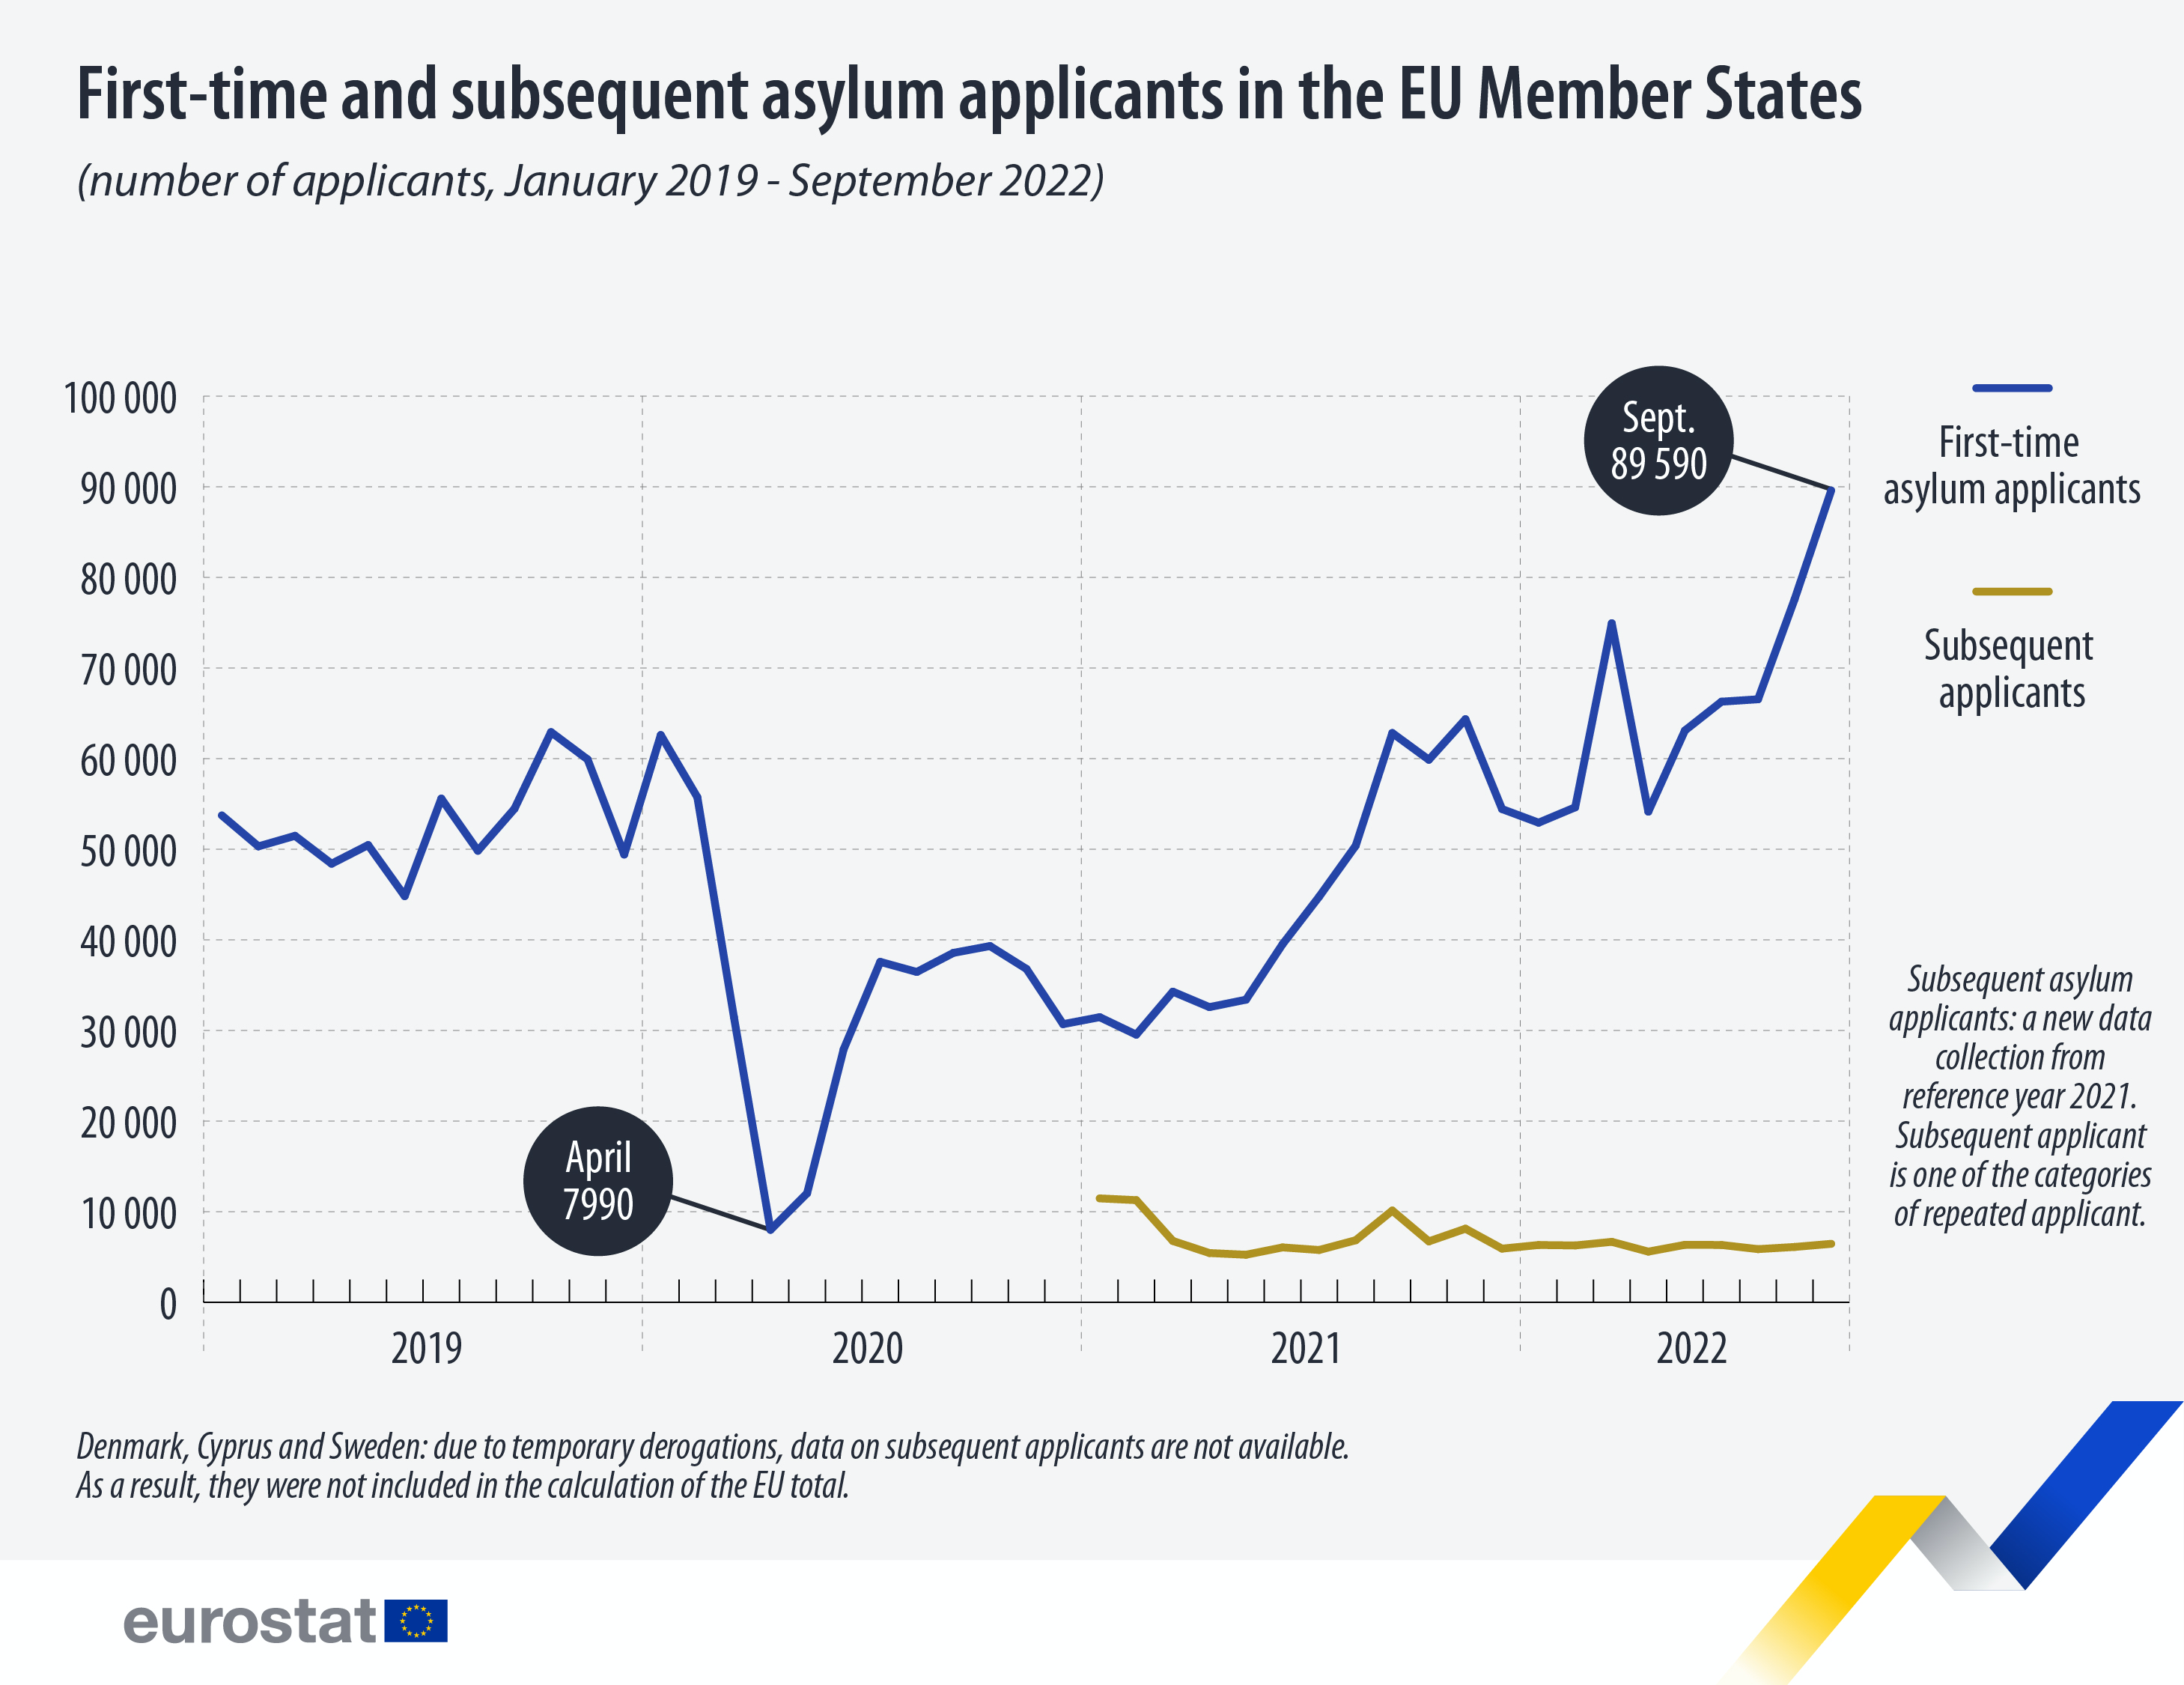
In September 2022, 89 590 first-time asylum applicants (non-EU citizens) applied for international protection in the EU Member States, 11 995 more people than in the previous month, an increase of
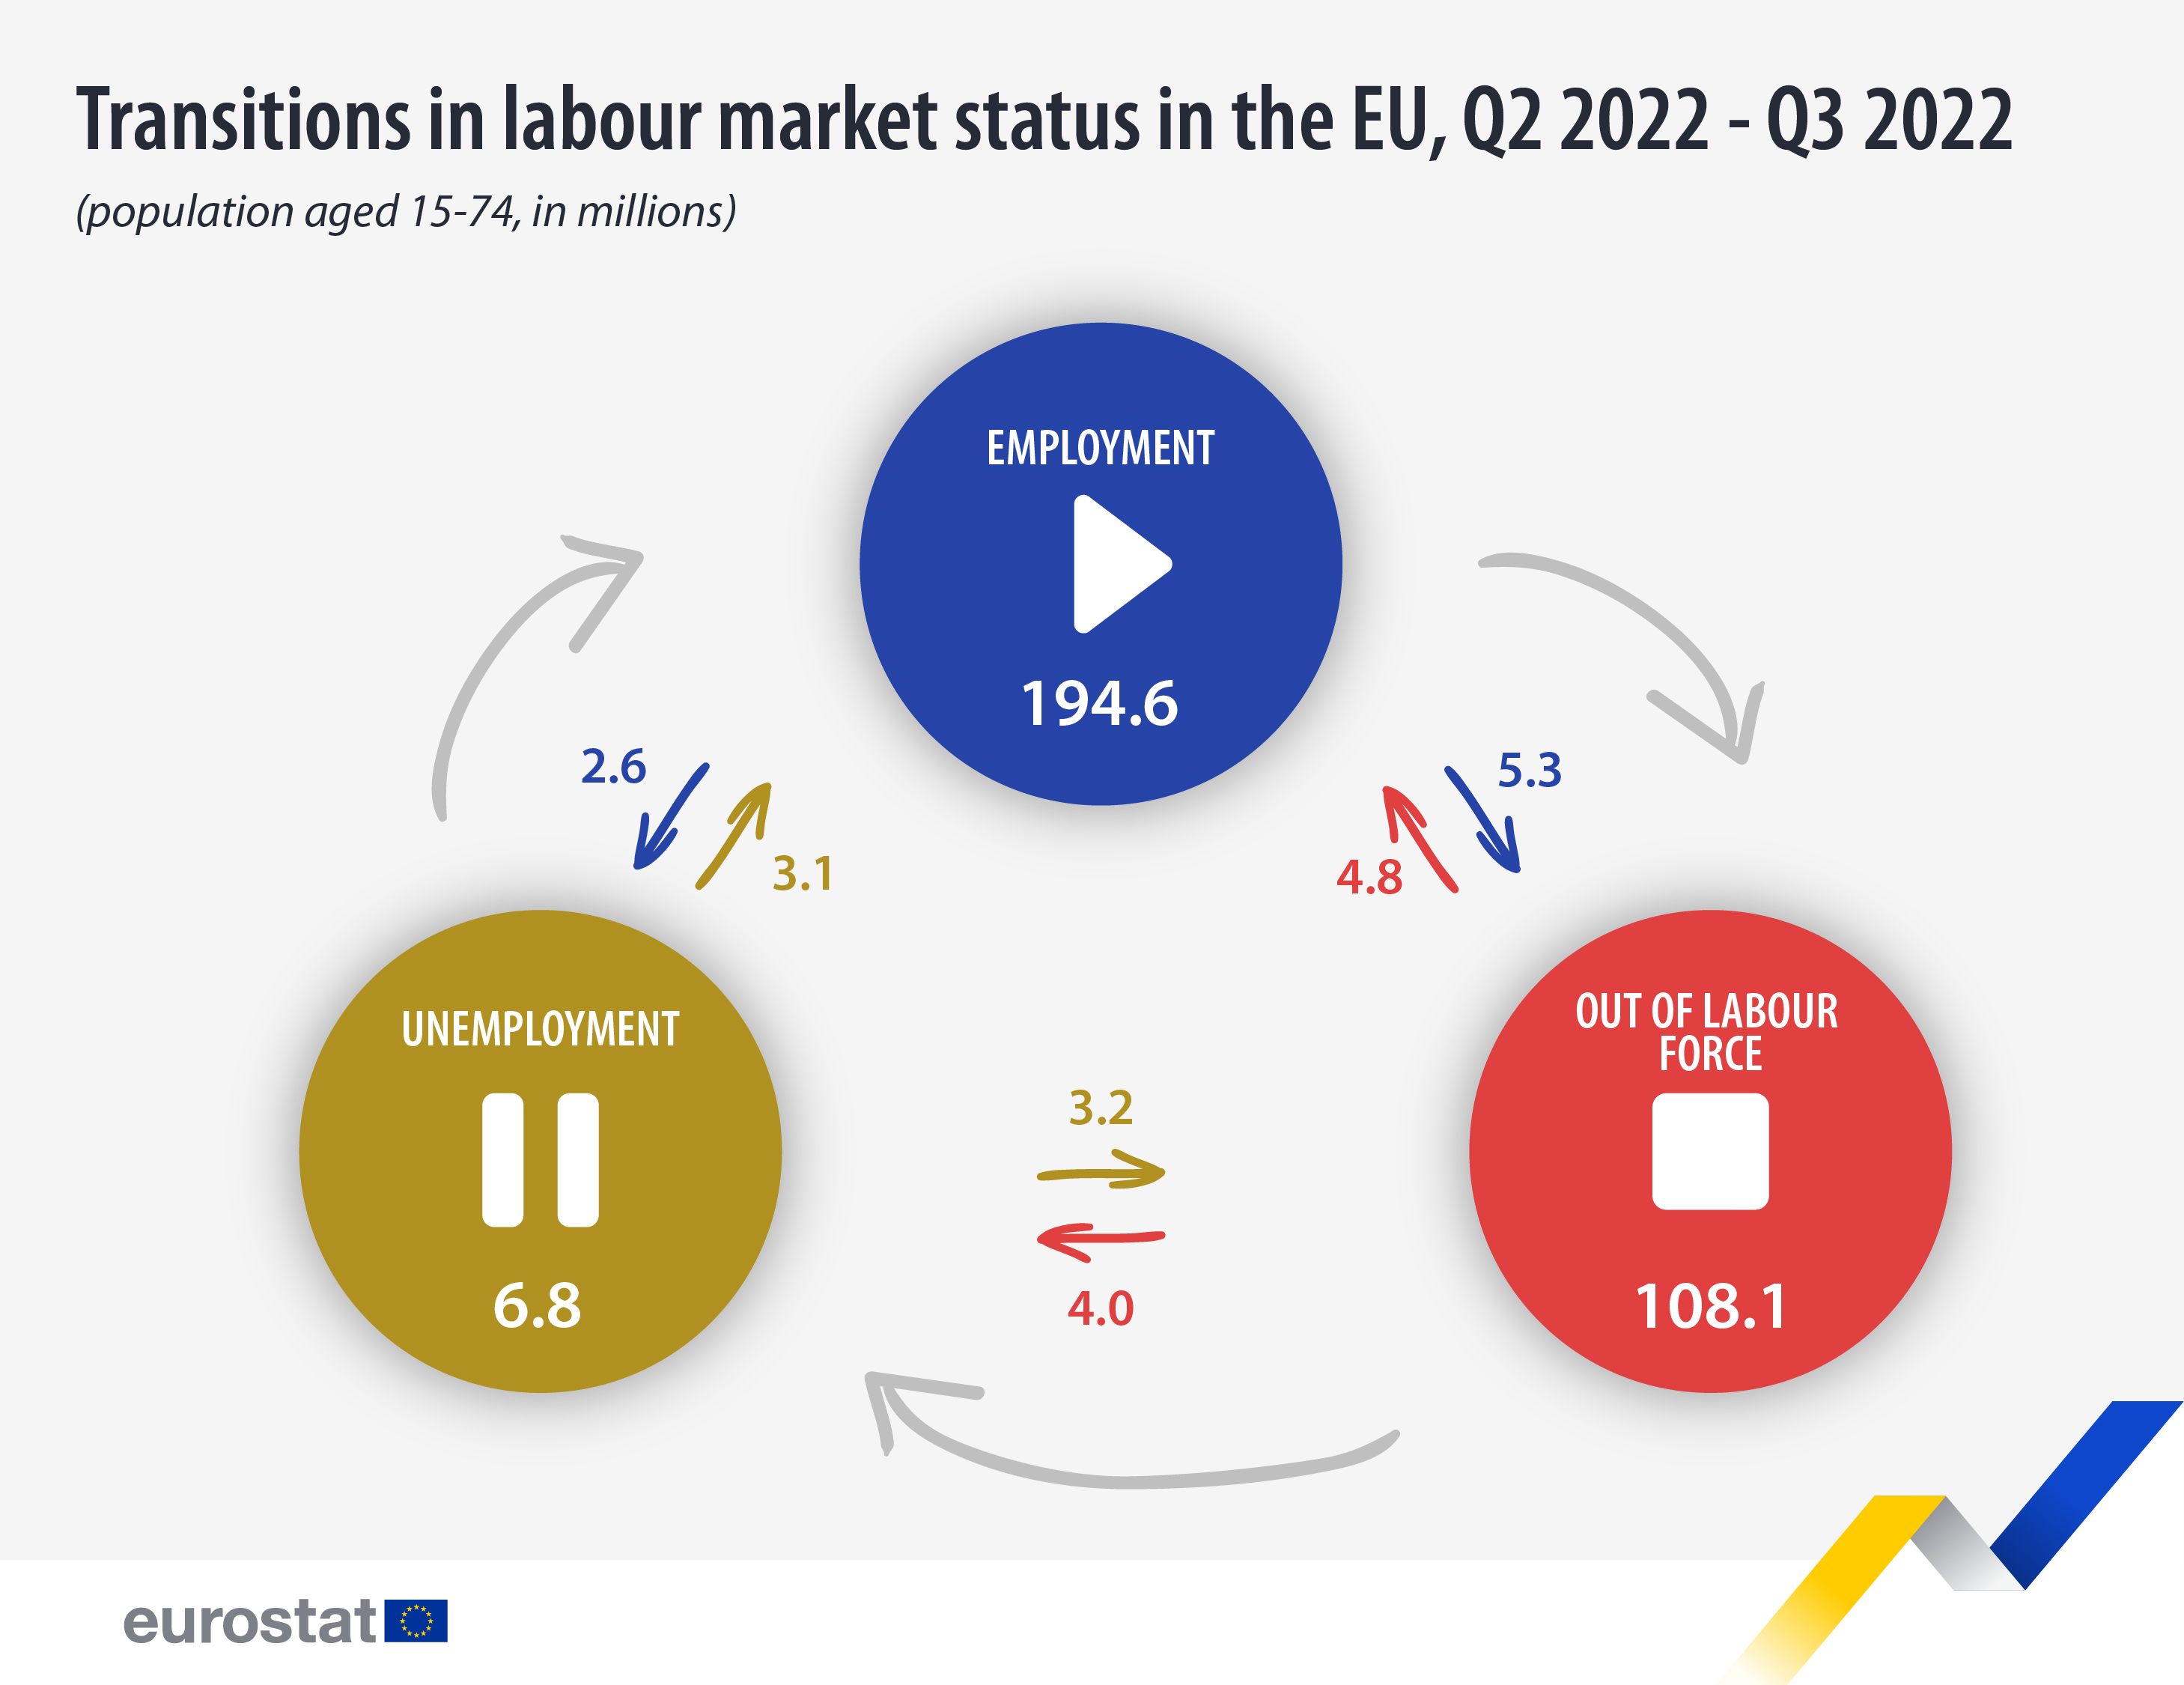
Between the second and the third quarter of 2022, 3.1 million unemployed people in the EU (23.4% of all unemployed in the second quarter of 2022) found a job.
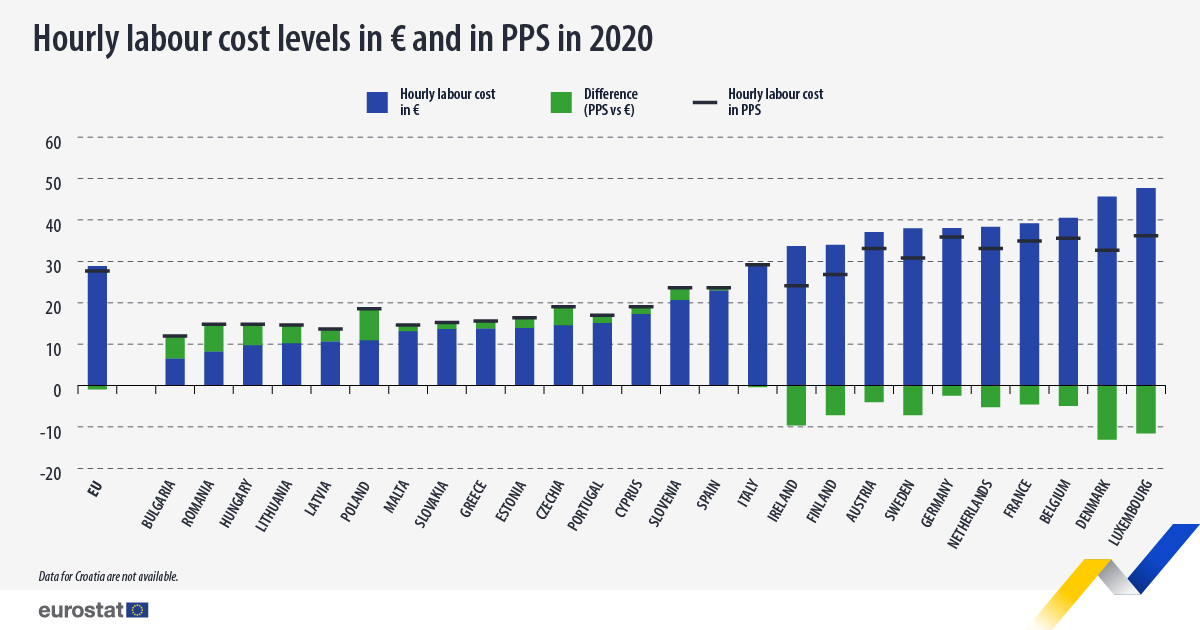
In 2020, the average hourly labour cost in the EU was €28.9.
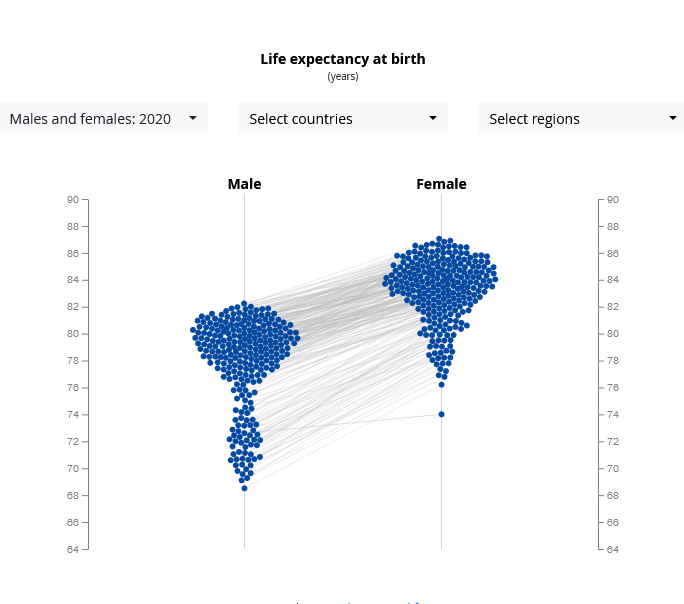
In 2020, life expectancy of a female newborn in the EU was 83.2 years, 5.7 years higher than for a male newborn (77.5 years).

